
THE LAB / A COMPLETE PROJECT, STEP BY STEP
From the ESP32-C3
to graphs
on your site.
A small board, Wi-Fi and a VPS: build a data chain you can check from the USB cable to the graph.
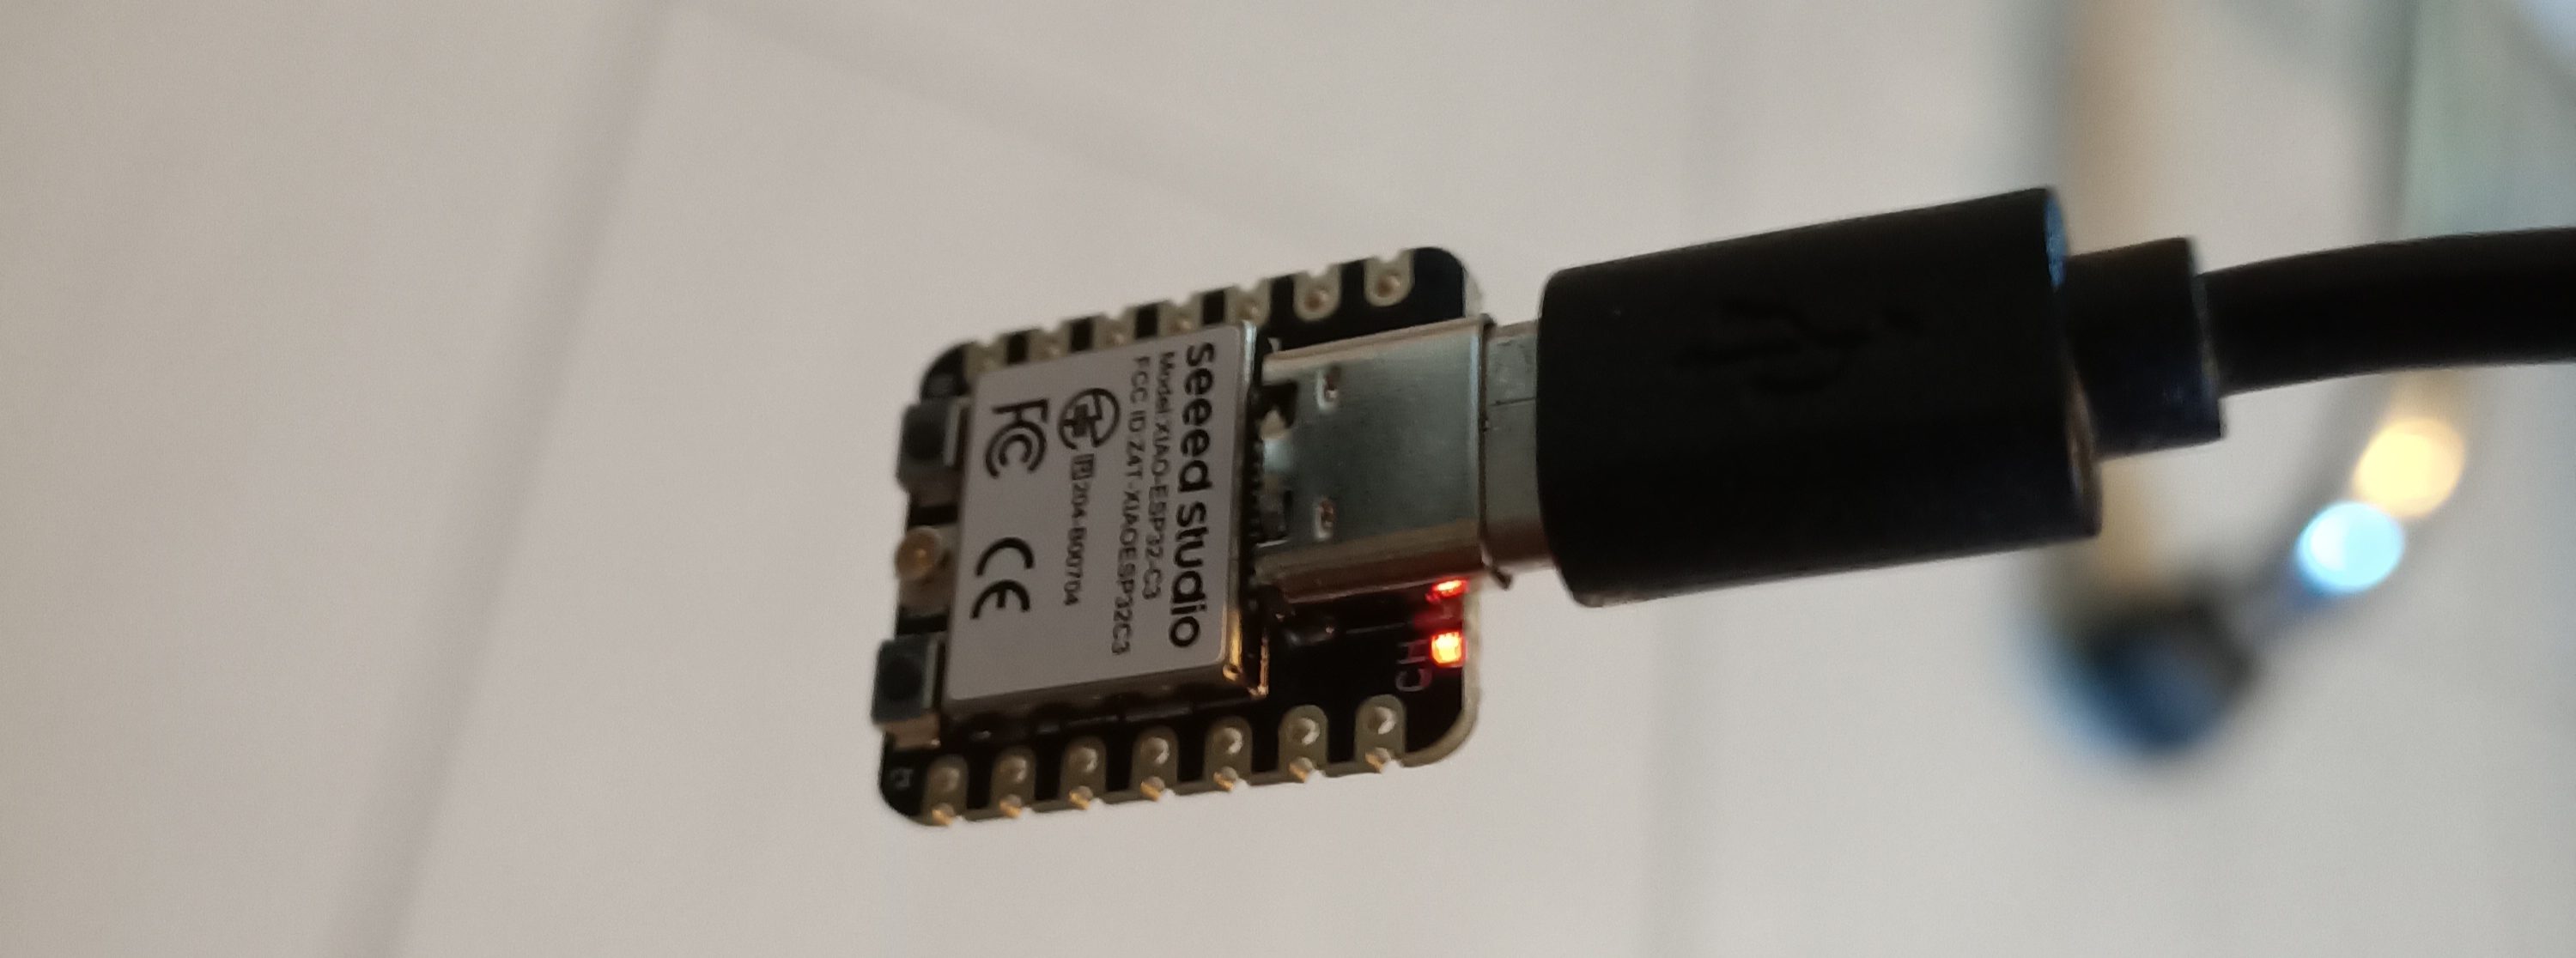
A learning path based on the setup built and tested on Quiet Bee.
A real chain with fictitious values. The demo's temperature and humidity values are simulated. Wi-Fi connectivity, HTTPS exchanges, storage and graphs operate for real.
UNDERSTAND BEFORE COPYING CODE
From the first byte to the graph.
- 01ESP32-C3Generate values
- 02Wi-FiConnect to the Internet
- 03HTTPSSend the message
- 04InfluxDB 3Keep the history
- 05Your siteRead the graphs
THE FIVE-STEP PATH
One setup, five checkpoints.
- 1
Identify the XIAO ESP32-C3
Install ESP32 support in Arduino IDE, select the correct board and enable USB CDC. The program responds to
*IDN?: its identity remains stable even if Windows assigns a new COM port.Check: the board responds in Termite at 115200 baud.
- 2
Join the home Wi-Fi network
Configure a 2.4 GHz network, then a second network if you use a repeater. Credentials stay on the board. If one attempt fails, the program tries the other network.
Check: an IP address and Wi-Fi signal appear in the diagnostics.
- 3
Prepare InfluxDB 3 on the VPS
Install the server, create the database
esp32and keep the data on disk. The service restarts automatically; the database remains accessible locally, behind the website.Check: an authenticated write is read back with a SQL query.
- 4
Send over HTTPS from the ESP32
Every 30 seconds, the program prepares line protocol data. A dedicated key authorises transmission; the server certificate is verified. A separate task keeps USB commands available.
Check: the message
MESURE ENREGISTREE | HTTP=204confirms transmission. - 5
Display graphs on your site
The web server reads authorised values from InfluxDB. The browser receives filtered data, never database keys. The demonstration displays fictitious temperature and humidity values; real diagnostics remain private.
Check: the graphs change and the CSV export is labelled as simulation.
Open the project result ↗
ON THE WORKBENCH
The minimum to get started.
- A XIAO ESP32-C3The Seeed Studio model used in this path.
- A USB-C data cableTo power, program and read diagnostics.
- An antenna and 2.4 GHz Wi-FiEnsure sufficient reception near the access point.
- A Linux VPS and an HTTPS domainTo host the database and web pages.
No external probe is required for this first demonstration. Choosing and wiring a real sensor will be a later step.
A METHOD YOU CAN REUSE
A graph is not enough.
Check the complete chain.
The board is identified. Wi-Fi works. The server confirms the write. SQL finds the point. The site displays it. These checks remain useful when fictitious data is replaced with real probe measurements.
Technical references
Tested setup versions: Arduino ESP32 3.3.12, firmware 1.3.0 and InfluxDB 3 Core 3.12.1. Guide edition: 27 October 2026.